Google Data Studio: Top 4 Favourite Google Data Studio Tips/Tricks
The Google Analytics ecosystem has certainly grown over the last few years. What started as a single product, has now branched out into numerous offshoots. You’ve got Tag Manager, Optimize, Data Studio, Polls, Adwords, Adsense, Google My Business, Waze (… Wait - When did Google get involved in Waze). Anyways, with all of the new products being launched, familiar products being rebranded or building into a product of their own, it can feel a little bit daunting.
I gotta be honest, when I first heard about Google Data Studio, I was a bit skeptical. I’d been an early adopter of other Google Products before, and have learned to be a little weary when new ones come out (when there is an entire website dedicated to their abandoned products, I feel like that’s justified https://killedbygoogle.com/)
However, Google Data Studio does something that I think has been lacking for a long time in analytics - it gives you the numbers you need.
In this article, I am going to give you my top 4 favourite Google Data Studio Tips/Tricks:
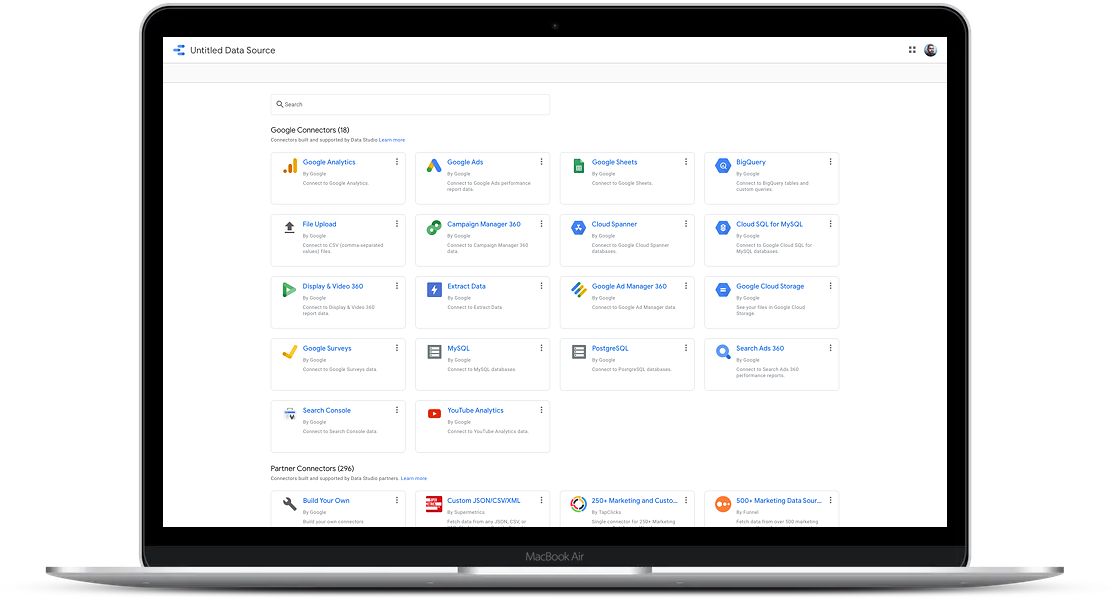
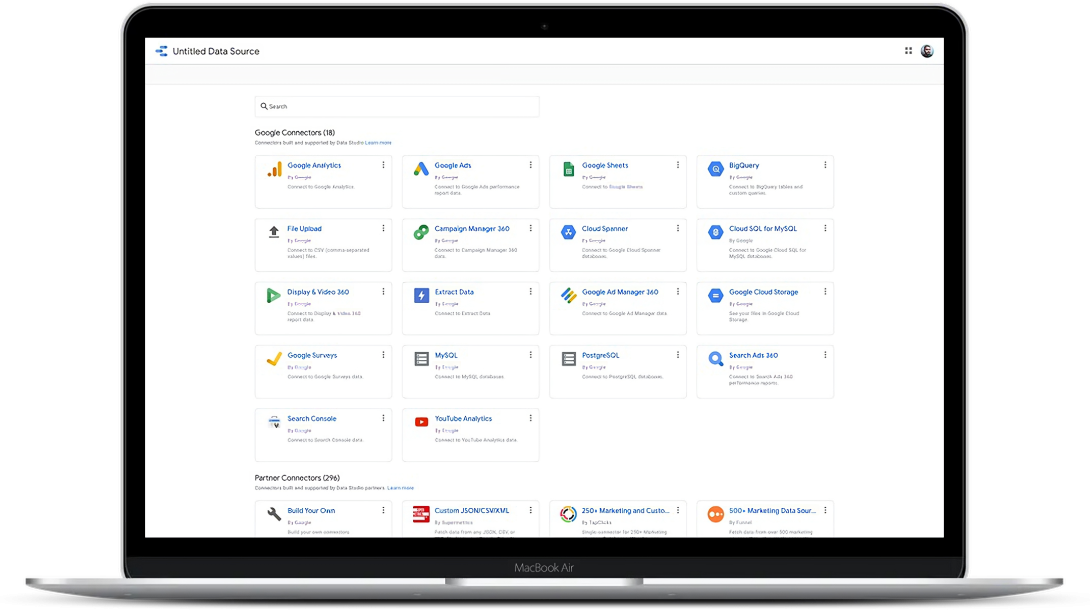
Connect Multiple Data Sources
At the time I wrote this, there are 18 Google built connectors, and nearly 300 partner connectors. A connector is quite simply types of data you can connect to. Have you fought with building multiple reports for the same campaign - trying to merge pdfs together or put the data into a static spreadsheet because you wanted to show it all in a consistent way? Well, with Data Studio, you can show your Google Analytics Sessions, Right beside your Youtube Views.
Being Able to Change the Date Range
Context is huge when it comes to data, and Google puts the controls right in the viewer’s lap. Just because you are sending out a weekly report, doesn’t mean that someone can’t open the report, and change date and actually get an update on the data. It’s unlikely that someone is checking every report that comes into the avalanche that most people call their email, so when they do get it, a data studio report can actually be dynamic. While it does send a weekly pdf that can’t be changed, if someone clicks the link, they can actually change the timeframe of the data they are viewing to get added context.
Report Templates
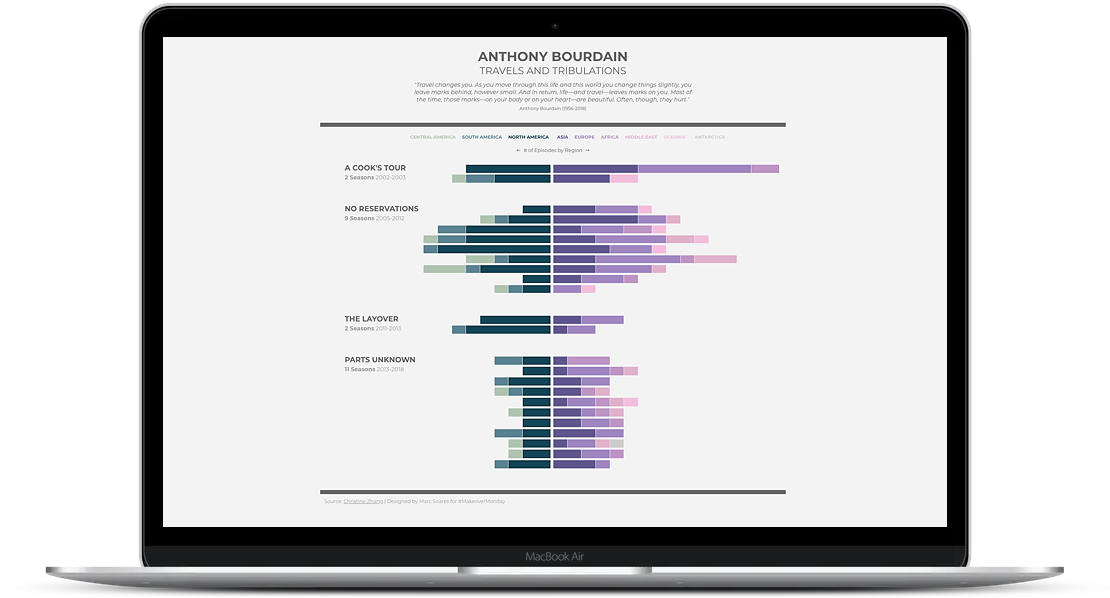
It can be really hard to know where to even start with Data Studio, and luckily there is a very robust Data Studio Gallery that you can start with. At the Report Gallery, you can find pre-built reports ranging from a template for all Non-Profit Reporting Needs or an overview of your site’s E-Commerce Performance. When you find a report you like, you can simply copy the report, connect your data sources and your good to go.
Want to check out something really cool - someone has even built a visual of the late Anthony Bourdain’s travels.
Free Training
Who doesn't love shiny certificates? Google offers a free course that takes you through how to use the product and even a guide to data visualization. While sometimes I find their certificates unnecessary, I will say that if you are building Data Studio reports, I would recommend starting here.
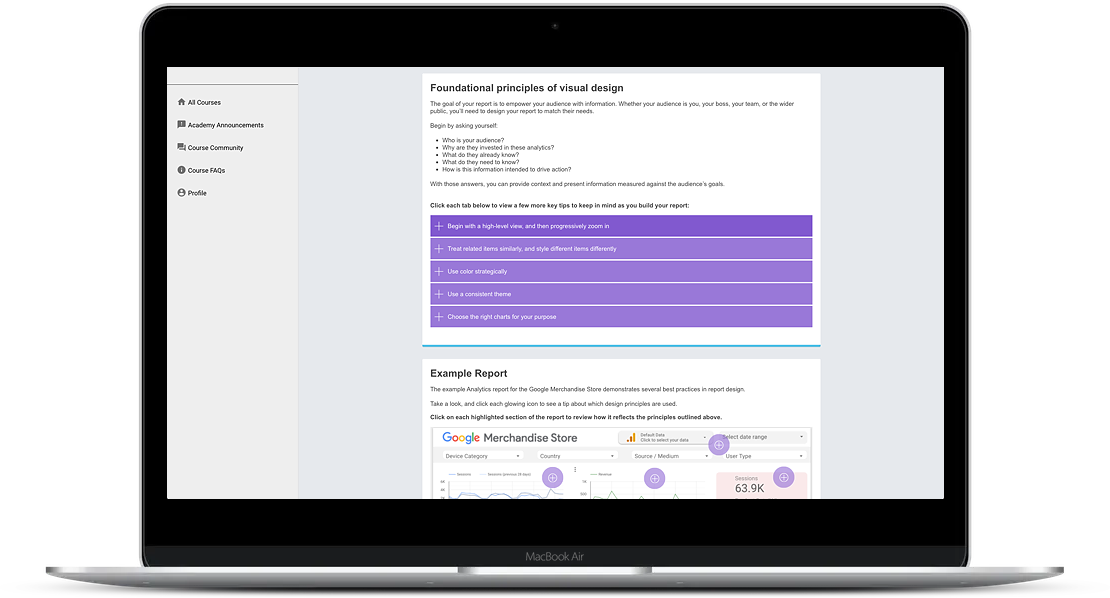
If you don’t want to learn about Data Studio, or you haven’t got the time to do the whole course, I would highly recommend doing the portion on Data Visualization Basics. For anyone who needs to prepare reports, it explores the foundations of visual design, so you can build more compelling reports.
We hope this piqued your interest in Google Data Studio. If you have questions, or would like some help from our team setting up your report, book a call today